The client’s company is a platform for creating a safer, stronger, and more supportive classroom experience for both teachers and students. The meditations are based on the scientifically proven iRest® Method and are specifically designed to fit into life to help them in handling anxiety and emotional development.
4 weeks of cooperation | EdTech
Tools Used:
GDS | SQL
Challenges:
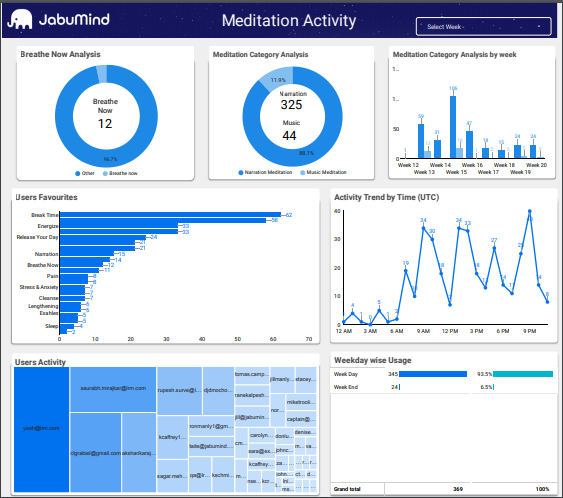
They were facing difficulty tracking the Meditation Activity of a Meditation App. Like Which meditation audience lists most and what time of day, what type of meditation people prefer, etc. So The requirement was to analyze their meditation data and get business insights through a dashboard.
Solution:
We have used Google Data Studio tool for designing the dashboards.Also the data was in Google sheet and we recommend then to use SQL as a database.It was 150 hours of work and almost 2 of our experienced data scientists have worked upon it.
By using our Visualization skill sets, we have built and design the dashboard to track the meditation activities and trends for users as a group and as individuals for a company with an online guided meditation app. We understand the key KPIs for mobile Apps like retention, daily active users, User check-in time, User mood according to the time,Usage of the app etc.
While looking at the dashboard the client can analyse all the KPIs they are looking for.They understand the users behaviour by looking at the dashboard that our team has designed. Here’s the dashboard-