
The client’s company is a platform where the customer will be able to analyze their skin and will get customized products that can do good to your skin. Their products are fuse-nature + science-based, using powerful marine ingredients from the world’s oceans, sustainably produced with Blue Biotechnology to help conserve our oceans.
14 months of cooperation | Beauty & Wellness
Tools Used:
Python | Tableau
Challenges:
They were facing issues while understanding the customer’s theory of buying a product. Also, we helped them to understand their business performance. They were excited to know the insights of:
1. To know the list of beauty products which contributed profit to the company.
2. To know the LTV and Profit made by each customer.
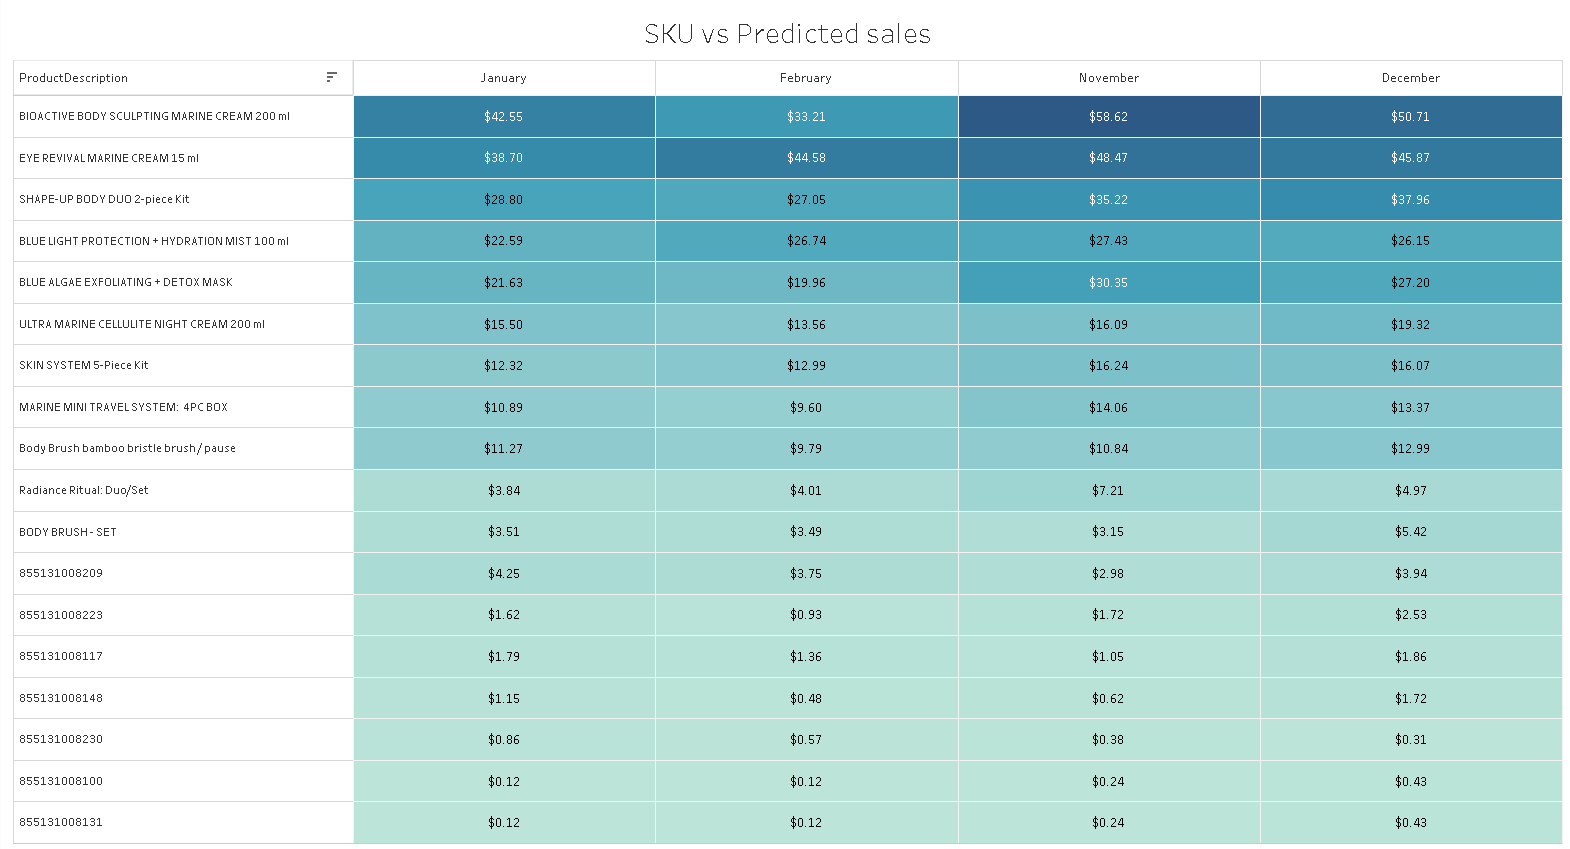
3. To know the LTV for the last 12 months, Gross sales for the last 9 months along with predicted sales for the next 3 months.
This predicted sale is the most important part which we invested more time in.
Solution:
By using complex Cohort Analysis we provided a better understanding of their customer segmentation and what they are expecting. We performed analysis for CLTV, trial conversions, and other important KPIs and showcased the ratios by developing and designing dashboards.
Using Tableau, we gave them a virtual reference of their numbers in a more appealing way. Also, for this, we have used complex ML models for optimized Data analysis and visualization. We have used Python for Data Analysis.

Results:
Due to our analysis, the company was able to improve its operating margin and increase it by 2 digits.