

The client’s company is a specialist automobile and liability insurance provider that works through insurance intermediaries in the United Kingdom.
3 months | Automobile Insurance
TOOLS USED:
PowerBI | Excel
CHALLENGES:
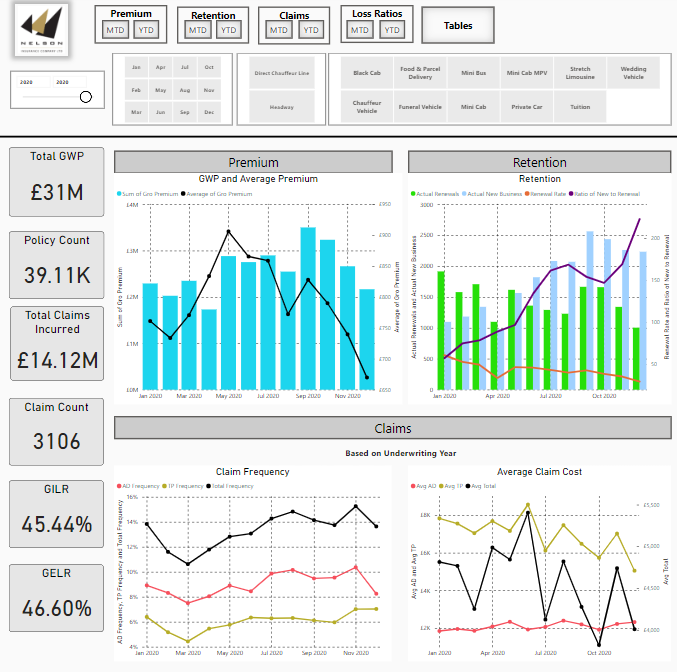
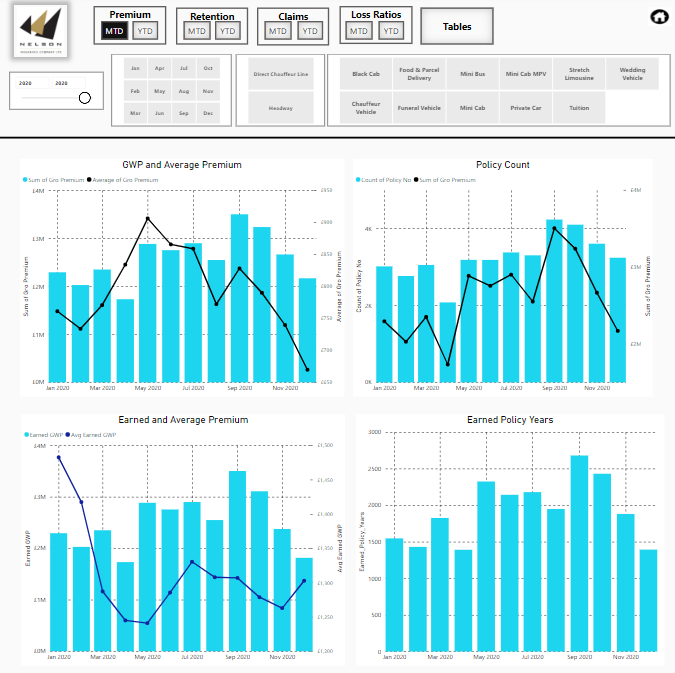
The client needed an insurance dashboard and the most challenging part about making it is calculating the renewal rate based on the given two dates per year-month in the same table.
The client wanted to create a relationship with the calendar table having four different dates, which was a challenge for us. They wanted us to calculate earned policy days for every 4 different date combinations and merge it all together.
They wanted us to visualize different KPIs such as Earned premium, Salvage recovery rate, Retention rate, Total claim frequency etc. and calculate MTD, YTD for different metrics.
SOLUTION:
The insurance dashboard was done using the user relationship with the calendar table. Through this method, we were able to calculate actual renewals and expected renewals.
We created a separate table where we summarized four different dates with the policy days to get the exact earned policy days for every combination of four different dates.
We created complex measures for the KPIs and visualized them using appropriate charts.
APPLICATION INTERFACE:
RESULTS:
The dashboard was smooth and interactive which represented all the required KPIs. It was a success for the team and the client.